利用 ptrace 设置硬件断点
x86 CPU 为断点调试提供了硬件上的支持。
x86 CPU 上设有专门的调试寄存器,
通过设置这些寄存器,
可以为进程设置代码执行断点和内存读写断点,
这些断点统称为硬件断点。
Linux 上的 ptrace() 系统调用可以用来设置 x86 CPU 上的这些调试寄存器,
所以我们可以利用 ptrace 来给进程设置硬件断点。
这篇文章将介绍如何利用 ptrace() 来设置硬件断点。
1. 硬件断点
x86 CPU 上的共有8个调试寄存器: DR0 - DR7。
其中 DR0 - DR3 为地址寄存器,
这四个寄存器是用来存放断点地址的,
只有四个断点地址寄存器意味着最多可以同时设置四个硬件断点。
DR4 和 DR5 是保留寄存器,并不使用。
DR6 是状态寄存器,设置硬件断点的过程中并没有用到该寄存器,这里不做更多介绍。
DR7 是控制寄存器,这个寄存是上有一系列的标志位。
通过设置 DR7 寄存器上的标志位可以设定某个断点的类型(读写断点或者执行断点),断点是否有效等。
我们来看下 DR7 寄存器中各个标志位具体的含义:
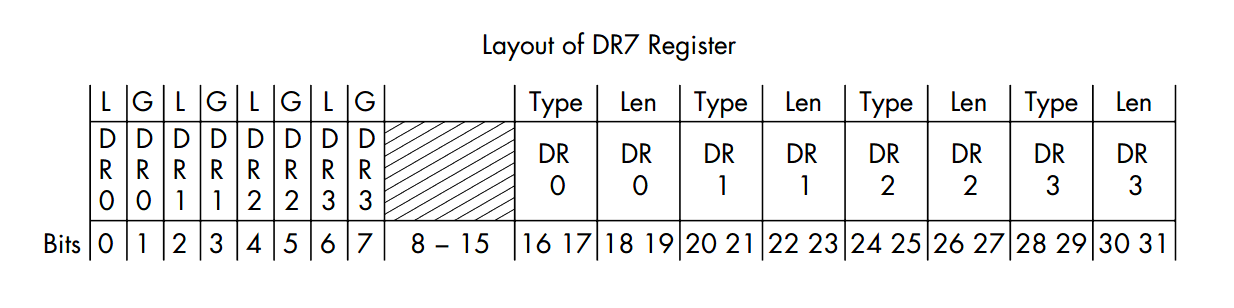
0 - 7 标志位控制 DR0 - DR3 寄存器指定的断点是否处于激活状态。
G 和 L 域分别代表 global 和 local 范围。
Gray Hat Python[1] 中说用户态的调试中设定 G 和 L 位没有区别。
看了下 wiki 上的介绍:
Note that when paging is enabled, different tasks may have different linear-to-physical address mappings. When this is the case, an address in a debug address register may be relevant to one task but not to another. For this reason the x86 has both global and local enable bits in DR7. These bits indicate whether a given debug address has a global (all tasks) or local (current task only) relevance.
根据这段话的理解,标志位 G 和 L 分别表示在启用分页机制的情况下,
相应调试地址寄存器影响的是所有进程还是只有当前进程。
是不是只要设置了 G 标志位那么所有进程运行到对应地址上都会暂停下来?
这个需要测试下才知道。
8 - 15 这几个是保留位,没有用到。
16 - 31 标志位指定断点的类型和长度。
长度是对于读写断点而言。
我们来看看如何通过 DR7 设置断点的类型:
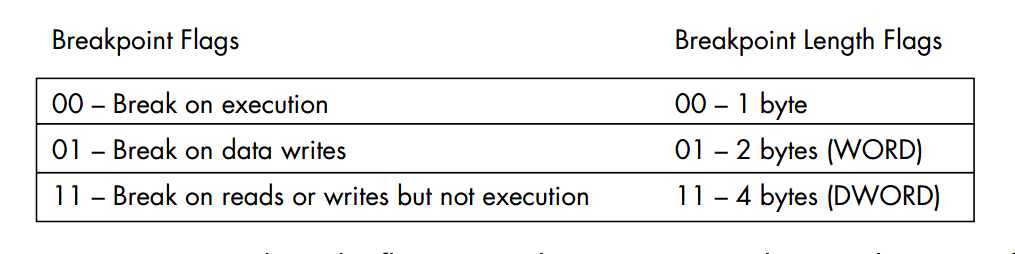
断点类型共有三种,00 代表执行断点,01 和 11 则代表写断点和读断点。
断点的长度是针对与读/写类型断点而言的。
和 DR0 - DR3 一起,断点长度字段指定了一块连续的触发读写中断的内存区域。
现在,我们在来看下,如何通过配合使用 DR0 和 DR7 寄存器来设置硬件断点:
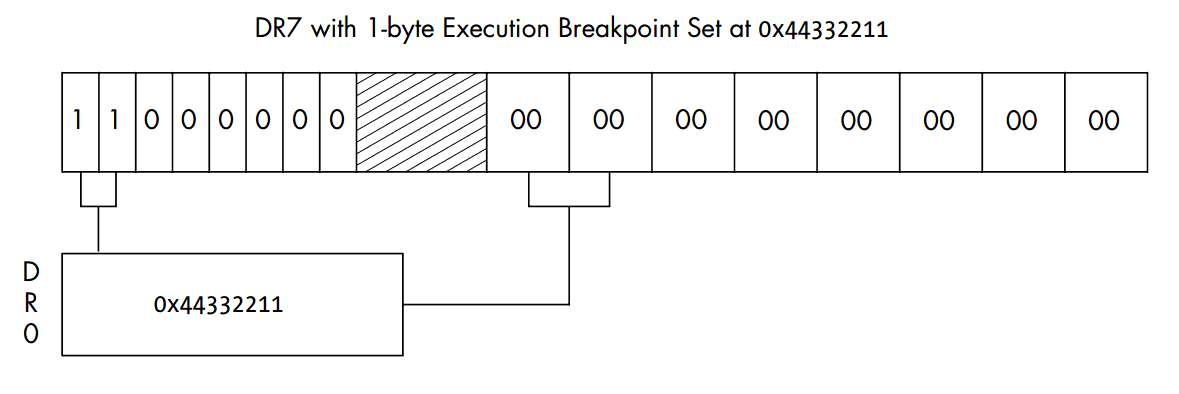
以上关于硬件断点内容及所用到的截图来自 Gray Hat PYthon 这本书,
在这个图里,通过 DR0 和 DR7 寄存器,在地址 0x44332211 处设置了一个硬件执行断点,
注意这图里同时设置 global 和 local 标志位,这是什么玩法,会导致什么结果?
2. 利用 ptrace 设置硬件断点
ptrace() 系统调用通过不同的请求类型来执行不同的操作。
其中 PTRACE_GETREGS/PTRACE_SETREGS 可以用来读取和设置用户寄存器。
PTRACE_GETREGS 将读取到的寄存器的值存放到结构体 struct user_regs_struct 中,
这个结构体在 /usr/include/sys/user.h 中定义。
查看这个结构体的话会发现,其中并没有 DR0 - DR7 这几个寄存器。
所以我一度怀疑 ptrace() 是否能用来操作调试寄存器。
直到在 stackoverflow 上看到这篇帖子才搞清楚:
调试寄存器是通过 `PTRACE_PEEKUSER/PTRACE_POKEUSER` 请求来控制。
PTRACE_PEEKUSER 请求可用于读取调试寄存器,
PTRACE_POKEUSER 请求可用于设置调试寄存器。
PTRACE_PEEKUSER/PTRACE_POKEUSER 请求也用到了寄存器结构体,
这个结构体也是在 /usr/include/sys/user.h 中定义,它是 struct user。
我们来看看 struct user 结构体中八个调试寄存器的定义:
struct user {
    ...
    __extension__ unsigned long long int  u_debugreg [8];  // 八个调试寄存器
};
和 PTRACE_GETREGS/PTRACE_SETREGS 请求不一样的是,
PTRACE_PEEKUSER/PTRACE_POKEUSER 请求一次只能获取/修改一个寄存器的值。
PTRACE_PEEKUSER/PTRACE_POKEUSER 请求通过指定一个偏移量来表明具体要读取/设置哪个寄存器的值。
譬如 DR0 寄存器对应的 struct user 结构体中的 u_debugreg[0] 字段,
该字段相对于 struct user 结构体起始的偏移量为 848, 那么 DR0 的值可以通过以下方式获取:
long dr0 = ptrace(PTRACE_PEEKUSER, pid, 848, NULL);
struct user 结构体中除了定义八个断点寄存器外还包含通用寄存器字段、浮点寄存器字段,
不知道 Linux 为什么要在不同的结构体中重复声明寄存器字段。
一个可能的原因是,
PTRACE_GETREGS 可以一次性的把所有通用寄存器的值都读出来了,
而 PTRACE_PEEKUSER 则可以一次只获取一个寄存器的值,
为了提高效率吧。
3. 代码实例
现在我们来看一个设置硬件断点的具体实例,代码如下:
#include <stdio.h>
#include <stdlib.h>
#include <string.h>
#include <libgen.h>

#include <wait.h>
#include <sys/types.h>
#include <unistd.h>
#include <signal.h>
#include <sys/ptrace.h>
#include <sys/user.h>

#define DR_OFFSET(num) 	((void *) (& ((struct user *) 0)->u_debugreg[num]))

int set_hwbp(pid_t pid, void *addr)
{
    unsigned long dr_7 = 0;

    if (ptrace(PTRACE_POKEUSER, pid, DR_OFFSET(0), addr) != 0) {
        perror("tracer, faile to set DR_0\n");
        return 1;
    }

    dr_7 = dr_7 | 0x01;  // set dr_0 local
    dr_7 = dr_7 | 0x02;  // set dr_0 global
    // dr_7 = dr_7 & ((~0x0f) << 16);  // type exec, and len 0
    if (ptrace(PTRACE_POKEUSER, pid, DR_OFFSET(7), (void *) dr_7) != 0) {
        perror("tracer, faile to set DR_7\n");
        return 1;
    }

    return 0;
}

void run_tracee(char *tracee_path)
{
    char *basec, *bname;
    char *argv[2] = {};

    if (ptrace(PTRACE_TRACEME, 0, NULL, NULL) != 0) {
        perror("tracee, failed setting traceme\n");
        exit(1);
    }

    if (kill(getpid(), SIGSTOP) != 0) {
        perror("tracee, failed stopping tracee");
        exit(1);
    }

    basec = strdup(tracee_path);
    bname = basename(tracee_path);
    argv[0] = bname;
    argv[1] = NULL;

    execv(tracee_path, argv);
}

int main(int argc, char **argv)
{
    int status, ret;
    pid_t tracee_pid;
    unsigned long addr = 0x400526;
    int brk_cnt = 0;

    if (argc < 3) {
        fprintf(stderr, "tracer, no program specified!\n");
        return 1;
    }

    addr = strtol(argv[2], NULL, 16);  // addr is a hex string

    printf("tracer, tracing program: %s\n", argv[1]);

    tracee_pid = fork();
    if (tracee_pid == 0) {  // within tracee
        run_tracee(argv[1]);
        fprintf(stderr, "tracee, we shoudl never reach here!\n");
        exit(1);
    } else if (tracee_pid < 0) {
        perror("tracer, failed forking tracee process\n");
        exit(1);
    }

    // within tracer
    ret = waitpid(tracee_pid, &status, 0);
    if (ret == -1) {
        perror("tracer, failed waiting tracee");
        exit(1);
    }

    // kill tracee on exit
    if (ptrace(PTRACE_SETOPTIONS, tracee_pid,
	    NULL, (void *) PTRACE_O_EXITKILL) != 0) {
        perror("tracer, faile setting PTRACE_O_EXITKILL for tracee\n");
        exit(1);
    }

    // // hwbp works only after execv is executed, otherwise
    // // the debug registers will be rest after execv
    // if (set_hwbp(tracee_pid, (void *) addr) != 0) {
    //     fprintf(stderr, "faield to set harware break point at 0x%lx\n", addr);
    // }

    if (ptrace(PTRACE_CONT, tracee_pid, NULL, NULL) != 0) {
        perror("tracer, resume tracee\n");
        exit(1);
    }

    ret = waitpid(tracee_pid, &status, 0);
    if (ret == -1) {
        perror("tracer, failed waiting tracee");
        exit(1);
    }

    // ok, now we are safe to set hardware break point here
    if (set_hwbp(tracee_pid, (void *) addr) != 0) {
        fprintf(stderr, "faield to set harware break point at 0x%lx\n", addr);
    }

    while(1) {
        if (ptrace(PTRACE_CONT, tracee_pid, NULL, NULL) != 0) {
            perror("tracer, resume tracee\n");
            exit(1);
        }

        printf("break count: %d\n", ++brk_cnt);

        ret = waitpid(tracee_pid, &status, 0);
        if (ret == -1) {
            perror("tracer, failed waiting tracee");
            exit(1);
        }

        if (WIFEXITED(status)) {
            printf("tracer, tracee exited!\n");
            break;
        }
    }

    return 0;
}
这个程序接收两个参数,
第一个参数指定被调试程序,第二个参数指定硬件断点的地址。
这个程序运行后将启动被调试程序,并在在指定位置设定一个硬件断点。
被调试程序的每一次断点都将被记录并打印出来。
在写一个简单的程序作为被调试程序:
#include <stdio.h>
#include <unistd.h>

void foo(int val) {
    if (val > 0) {
        printf("val: %d\n", val);
    } else {
        printf("val: %d\n", val + 1);
    }
}

void bar(int cnt) {
    int i;

    for (i = 0; i < cnt; i++) {
        foo(i);
    }
}

int main()
{
    bar(5);

    return 0;
}
编译 hw_bp.c 和 test.c:
$ gcc test.c -o test    # 被调试程序
$ gcc hw_bp.c -o hw_bp  # 设置硬件断点的程序
通过 objdump 确定 test.c 中 foo 函数的入口:
$ objdump -d test

test:     file format elf64-x86-64


Disassembly of section .init:

00000000004003c8 <_init>:
...
...
0000000000400526 <foo>:
  400526:       55                      push   %rbp
  400527:       48 89 e5                mov    %rsp,%rbp
  40052a:       48 83 ec 10             sub    $0x10,%rsp
  40052e:       89 7d fc                mov    %edi,-0x4(%rbp)
...
...
可以看到 foo() 函数的入口地址为 0x400526, 现在来执行测试:
$ ./hw_bp test 0x400526
tracer, tracing program: test
break count: 1
break count: 2
val: 1
break count: 3
val: 1
break count: 4
val: 2
break count: 5
val: 3
break count: 6
val: 4
1 2 3 5
tracer, tracee exited!
dr0: 848
可以看到,共有六条中断记录。
第一次中断是 execv 执行完后触发的,剩下的五次中断则是由 hw_bp 设置的硬件断点触发的,
这说明我们设置的硬件断点生效了。
编写和测试断点设置程序的过程中还发现,
调试寄存器的设置必须在 execv() 执行之后,
否则调试寄存器的值会在 execv() 执行过后被清零,这样之前设置的硬件断点就无效了。
Reference
[1] Gray Hat Python