node_exporter 性能优化
k8s 集群中通常会部署 node_exporter 用于采集节点的基础信息。
在 k8s 集群运行一段时间后我们发现 node_exporter 占用的 CPU 明显增多。
利用 pidstat 统计 node_exporter 的 CPU 使用率,持续大约 40s 左右
Average: 65534 39269 15.78 3.95 0.00 19.73 - node_exporter
可以看到 cpu 平均使用率大约 19.73%。
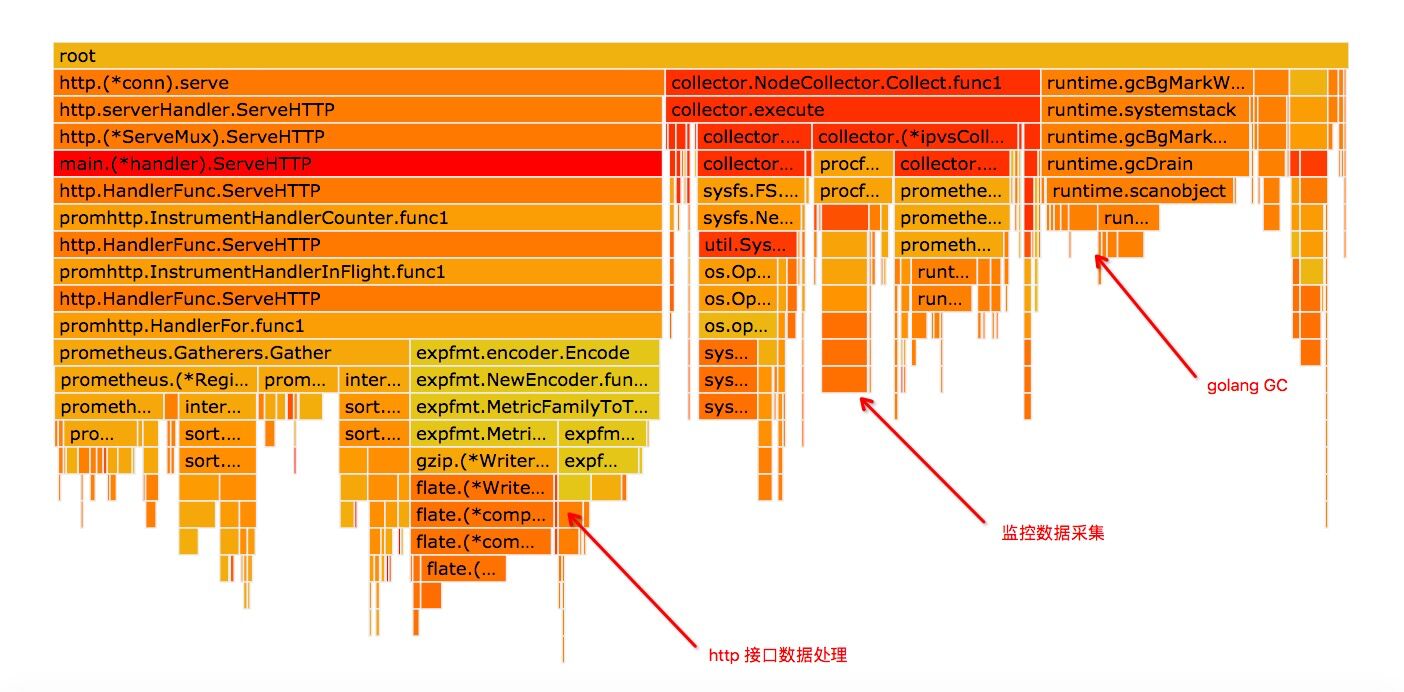
对 node_exporter 做下 profile,从火焰图里我们可以看到用的 CPU 消耗可以分为三个部分:
- http 接口数据处理
- node_exporter 基础数据采集(火焰图里主要是 net class 数据和 ipvs 相关 collector 数据的采集)
- golang gc
调用基础监控数据采集接口的,发现接口 RT 达到 8s 以上,监控数据有 3.2M。
$ time curl http://127.0.0.1:9100/metrics -o ne.txt
  % Total    % Received % Xferd  Average Speed   Time    Time     Time  Current
                                 Dload  Upload   Total   Spent    Left  Speed
100 3245k    0 3245k    0     0   386k      0 --:--:--  0:00:08 --:--:--  737k

real	0m8.412s
user	0m0.004s
sys	0m0.018s
$ ls -lh ne.txt
-rw-r--r--. 1 root root 3.2M Nov  1 18:58 ne.txt
其中大部分都是 ipvs、和 docker veth 设备的监控数据,和火焰图中的结果是吻合的。
实际上,目前我们是用不到这些数据的。
通过以下两个 node_exporter 的选项参数我们把 ipvs 和 veth 设备的采集项禁掉:
--no-collector.ipvs
--collector.netdev.ignored-devices='(^(lo|docker[0-9]|veth.+)$)'
重新启动 node_exporter,观察现在监控数据采集情况:
$ time curl http://127.0.0.1:9100/metrics -o ne.txt
  % Total    % Received % Xferd  Average Speed   Time    Time     Time  Current
                                 Dload  Upload   Total   Spent    Left  Speed
100  226k    0  226k    0     0   326k      0 --:--:-- --:--:-- --:--:--  326k

real	0m0.699s
user	0m0.003s
sys	0m0.005s
$ ls -lh ne.txt
-rw-r--r--. 1 root root 227K Nov  1 19:01 ne.txt
我们看到,接口调用时间从 6.345s 降到了 0.699,数据大小也从 3.2m 下降到 227k。
仍旧用 pidstat 观察 node_exporter 的 cpu 使用率:
Average: 65534 15173 1.82 2.27 0.00 4.10 - node_exporter```
我们发现 cpu 使用率从 15.37% 降到了 4.10%。
此时我们再看 pprof 的火焰图:
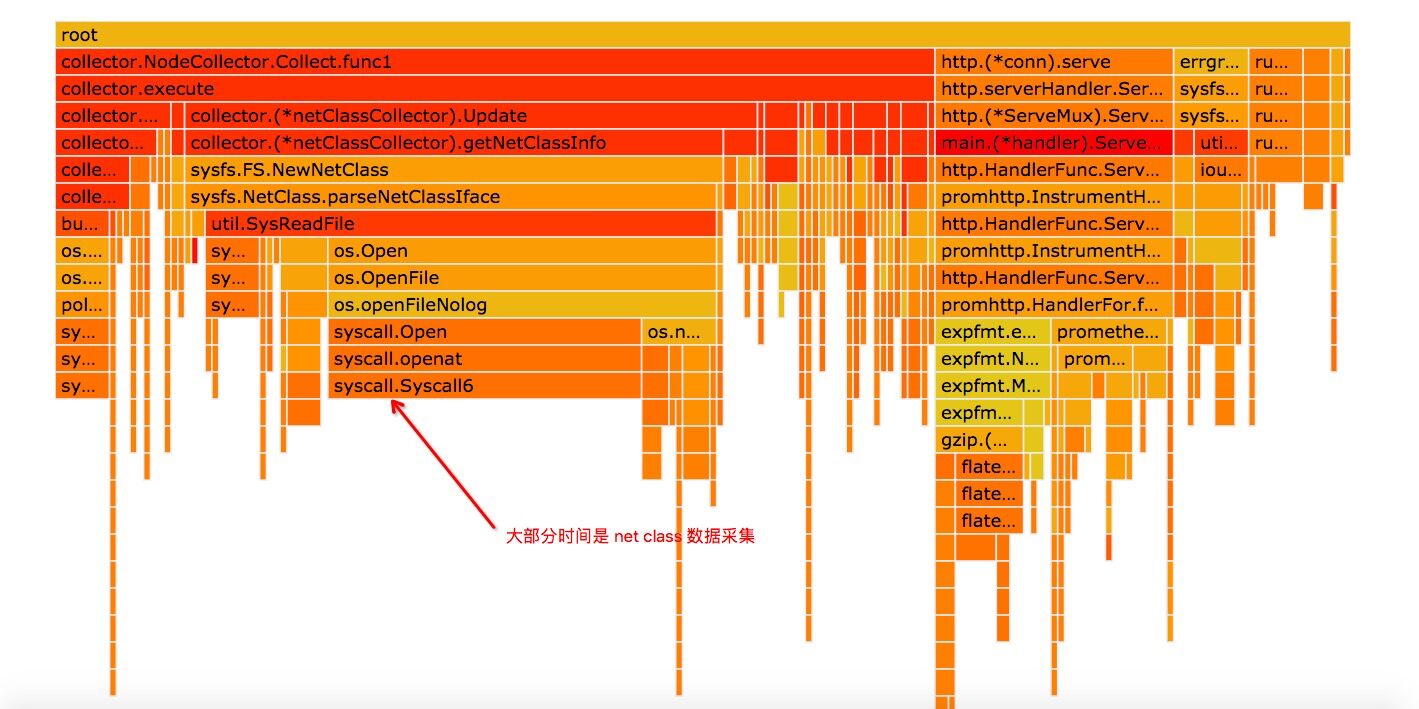
我们发现 gc 部分的 cpu 基本上消失了,此时 cpu 消耗的大头是 net class 监控项采集,
虽然我们已经关闭了大部分的 veth 数据的采集,
但是服务器上的其他网络设备信息还是要采集的,而 net class 下的数据项还有不少,
暂时先不考虑这快的优化。
在测试程序的时候,我们同时也打开了 golang 的 gctrace,
gc 170 @175.017s 2%: 97+103+0.046 ms clock, 3890+0.52/7.3/0+1.8 ms cpu, 5->6->2 MB, 7 MB goal, 40 P
gc 171 @175.425s 2%: 0.025+9.1+0.037 ms clock, 1.0+0.28/5.3/1.5+1.5 ms cpu, 4->4->2 MB, 5 MB goal, 40 P
gc 172 @175.526s 2%: 0.030+88+0.046 ms clock, 1.2+0.31/95/1.2+1.8 ms cpu, 4->5->3 MB, 5 MB goal, 40 P
gc 173 @184.768s 1%: 5.3+41+0.070 ms clock, 212+43/167/0.006+2.8 ms cpu, 6->8->2 MB, 7 MB goal, 40 P
gc 174 @184.918s 1%: 96+100+8.0 ms clock, 3877+0.15/6.6/0+323 ms cpu, 4->6->3 MB, 5 MB goal, 40 P
从数据结果上看,gc 的代价并不高,只占 1-2% 左右,不过,我们此时注意到到日志行最后面的40P。
我们测试的是一台逻辑 40 核的机器,因为没有配置 GOMAXPROCS,golang 把 P 值设置为默认的 40 了,
然而我们给 node_exporter 容器分配的 CPU 资源还不到 1 核。
这种情况下估计会有很多时间浪费在锁竞争上,同时也可能导致而外的 gc 代价(虽然每次 gc 成本只有 1-2%)。
我们把 GOMAXPORCS 设置为 1 做进一步测试。
我们观察到 CPU 使用率进一步下降到 3.15%:
Average: 65534 2935 1.63 1.51 0.00 3.15 - node_exporter
cpu 使用率的下降虽然不明显,但是我们观察到接口 rt 从 0.699s 进一步下降到 0.354s,这个提升还是不错的。
$ time curl http://127.0.0.1:9100/metrics -o ne.txt
  % Total    % Received % Xferd  Average Speed   Time    Time     Time  Current
                                 Dload  Upload   Total   Spent    Left  Speed
100  226k    0  226k    0     0   651k      0 --:--:-- --:--:-- --:--:--  652k

real	0m0.354s
user	0m0.003s
sys	0m0.006s
$ ls -lh ne.txt
-rw-r--r--. 1 root root 227K Nov  1 19:10 ne.txt
再看 gc 情况:
gc 166 @225.669s 0%: 0.008+13+0.006 ms clock, 0.008+1.8/4.0/0+0.006 ms cpu, 4->4->2 MB, 5 MB goal, 1 P
gc 167 @225.864s 0%: 0.011+75+0.006 ms clock, 0.011+14/24/0+0.006 ms cpu, 4->4->2 MB, 5 MB goal, 1 P
gc 168 @229.262s 0%: 0.038+8.8+0.005 ms clock, 0.038+1.1/0.71/0+0.005 ms cpu, 4->4->0 MB, 5 MB goal, 1 P
gc 169 @229.386s 0%: 0.008+9.4+0.004 ms clock, 0.008+0.42/2.6/0+0.004 ms cpu, 4->4->1 MB, 5 MB goal, 1 P
gc 170 @229.676s 0%: 0.009+11+0.005 ms clock, 0.009+1.5/2.7/0+0.005 ms cpu, 4->4->2 MB, 5 MB goal, 1 P
gc 171 @229.696s 0%: 0.009+78+0.006 ms clock, 0.009+0.13/5.0/61+0.006 ms cpu, 4->4->2 MB, 5 MB goal, 1 P
可以看到调整过后,gc 代价从 1-2% 下降到 0% 。